
 SEO
Multiple client websites
SEO Growth — Search Visibility & Authority
Ongoing SEO built on Search Console data, Ahrefs authority analysis and technical fixes — tracked in real dashboards, not vanity reports.
View Case StudyThe data existed, but it lived in scattered exports and platform screens — nobody could answer simple questions about performance without hours of manual work.
Connect the sources once, model the metrics that matter, and design dashboards a non-analyst can read in thirty seconds — with filters for deep dives.
Live, filterable dashboards replacing manual spreadsheet reporting — performance questions answered in moments, not days.
Keep exploring
SEO
Multiple client websites
Ongoing SEO built on Search Console data, Ahrefs authority analysis and technical fixes — tracked in real dashboards, not vanity reports.
View Case Study Paid Advertising · Tracking
Google Ads & Meta advertisers
End-to-end conversion tracking: Google Tag Manager setup, event tracking, data layer work and server-side Meta purchase tracking — validated in debug mode.
View Case Study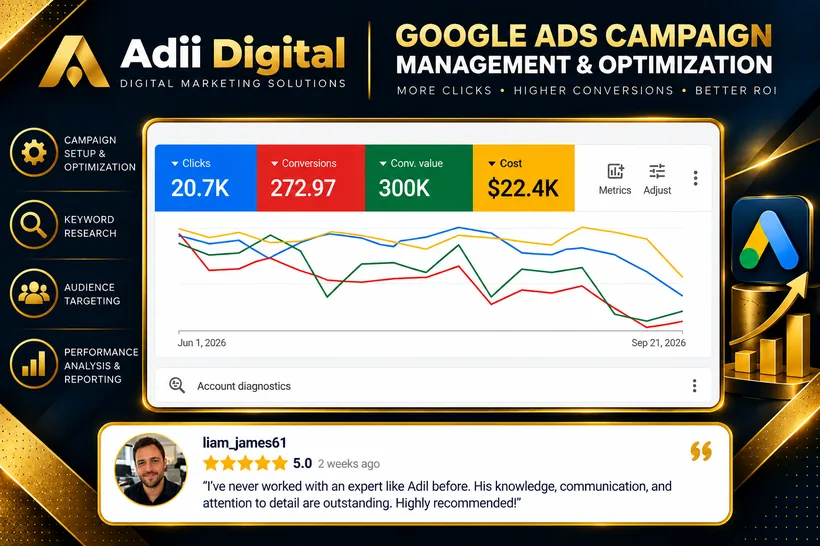 Paid Advertising · Google Ads
Lead generation & e-commerce advertisers
Full Google Ads management — campaign setup, keyword research, audience targeting and continuous optimisation, reported through live performance dashboards.
View Case Study